A Gantt chart graphically displays the planned project activities (work packages) in the form of bars on a time axis.
In project management, the Gantt chart is one of the most common instruments for displaying a time schedule. The term Gantt chart goes back to Henry Laurence Gantt, who developed the Gantt chart in 1910.
Inhaltsverzeichnis
The initial situation
In order to plan a project and to divide it into controllable elements, a work breakdown structure (WBS) is usually created today. This structures the project into manageable subtasks and work packages. Creating the work breakdown structure is one of the most important tasks in project planning.
While the work breakdown structure is ideally suited to reflect content planning, it is not suitable for depicting scheduling and process planning. The Gantt chart is the first choice in project management for the representation of the project flow on the time level.
Goals of the Gantt chart
- Representation of activities/work packages in the project in graphical form on a time axis
- Visualized representation of the duration and temporal location of the project phases and work packages
- The milestones of the project can also be integrated in the Gantt chart.
- Due to the strong visualization, the Gantt chart is a good communication tool in the project.
Networked Gantt chart
With the networked Gantt chart, the most important dependencies between the individual work packages are displayed in addition to the Gantt chart. The dependencies can be of different nature (e.g. process-related and logical dependencies, resource-related dependencies).
Attention: If you try to display too many – or even all – dependencies in the networked Gantt chart, this plan quickly becomes unreadable and therefore worthless. Here it is important to find the right balance as a project manager. It is quite clear: less is more!
Creation of the Gantt chart
The preferred field of application for the Gantt chart are small, manageable projects with not too many work packages. In complex projects the overview is quickly lost due to the large number of work packages – here it is necessary to compress the Gantt chart accordingly (e.g. on phase level).
The earliest bar charts were drawn on paper and therefore had to be redrawn when changes were made. From the 1980s, the first software applications for the PC were available that allowed project managers to quickly adapt and update bar charts. In the meantime it can be assumed that bar charts are only created and maintained with the use of tools.
Tip: Today, simple bar charts can be created with any common spreadsheet (MS Excel, Apple Numbers, Google Tables, ….).
When is the Gantt chart created?
The creation of the Gantt chart is one of the last steps in project planning. The basis for scheduling should always be a solidly planned Work Breakdown Structure (WBS). The work breakdown structure (WBS) is the core of project planning.
If all work packages in the work breakdown structure are provided with start and end dates, it is always possible to create a visualized Gantt chart based on this data.
The difference between the PSP and the Gantt chart is in reality none. It is only the different visual representation. Modern project management tools can now generate these plans at the push of a button based on the existing data – which only needs to be entered once.
It is essential to avoid starting the project planning with the schedule (and the Gantt chart).
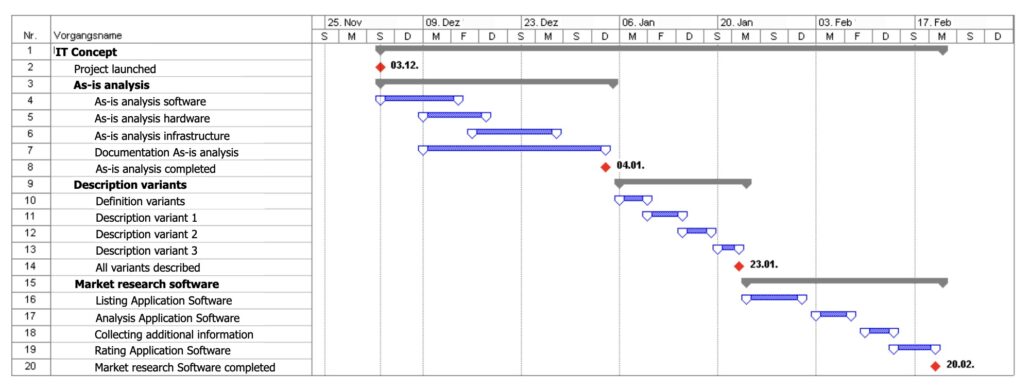
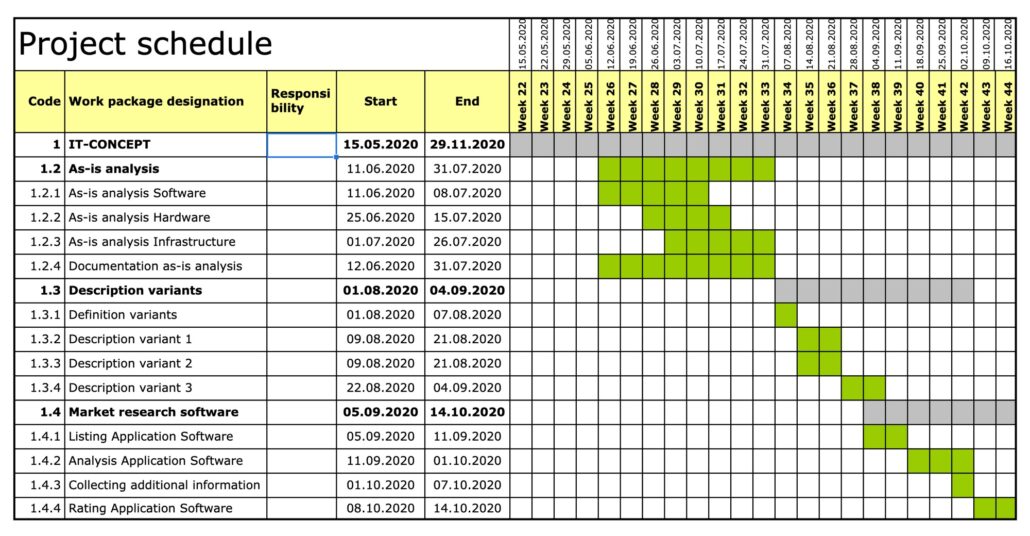
Examples Gantt chart
Example Gantt chart – created with MS-Project
Example Gantt chart – created with Excel
Practical tips and tricks
- Make the estimates for the duration of the work packages necessarily on the basis of the planned lead time (and not on the basis of resource expenditure).
- Display only the most important dependencies of the work packages in the networked bar chart, otherwise the chart quickly becomes unclear.
- Process-oriented planning simplifies project controlling
- The graphical display makes overlaps visible very quickly